Waste Statistics Every Plastic Maker Should Know
If you work with plastic, numbers tell the real story. Waste statistics show how much material ends up in landfills, how much gets recycled, and where you can cut losses. Knowing these figures helps you plan production, meet regulations, and boost your brand’s green cred. Let’s break down the data you need right now.
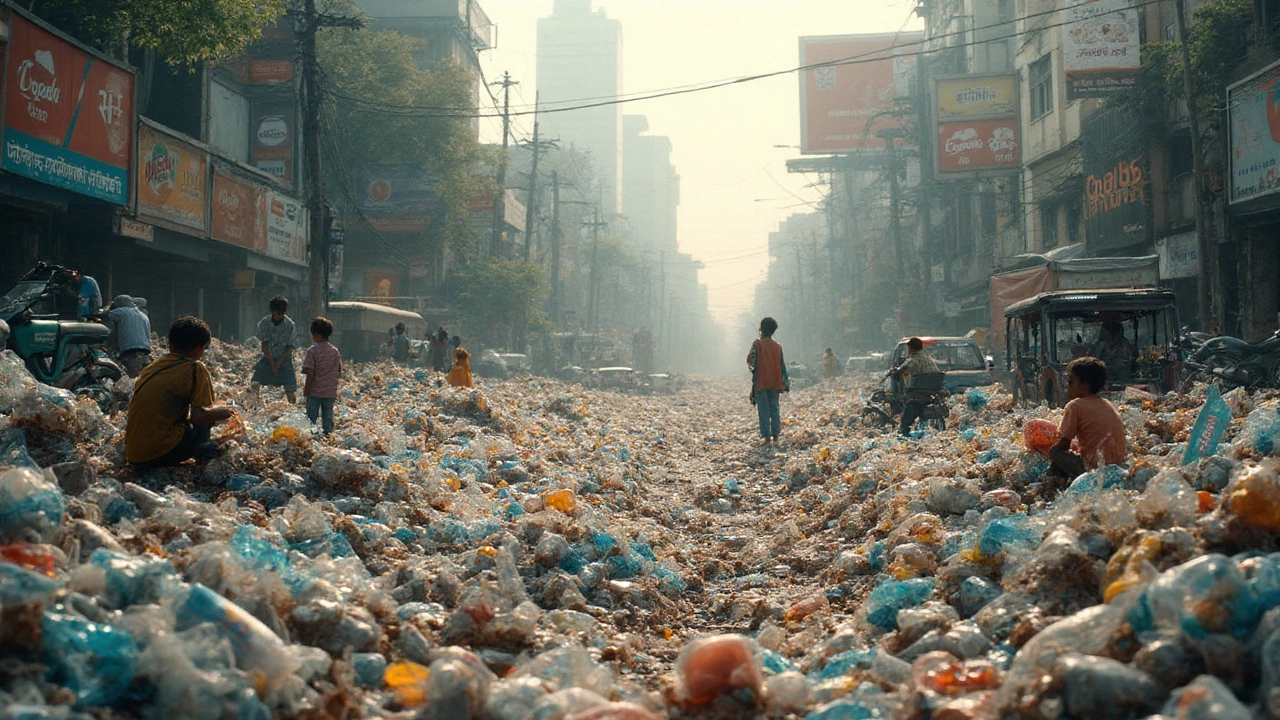
Current Plastic Waste Landscape in India
India generates roughly 3.5 million tonnes of plastic waste each year, and about 30% of that is collected for recycling. The rest piles up in streets or dumps, creating environmental headaches. Urban Polymers India tracks this flow closely because it impacts raw‑material costs and supply chain reliability. When recycling rates improve, the price of reclaimed resin drops, giving manufacturers a cheaper, greener feedstock.
Another useful metric is the per‑capita plastic use, which sits at about 30 kg per person annually. That figure helps you forecast market demand and design packaging that uses less material without sacrificing strength. By comparing regional data, you can spot cities where waste collection is stronger and target those markets for higher‑value recycled products.
How Waste Data Drives Better Decisions
Numbers aren’t just for reports—they guide daily operations. For example, if your plant’s scrap rate is 5 % higher than the industry average, you can investigate why: maybe a machine is mis‑aligned or the material mix is off. Cutting scrap not only saves money but also reduces the waste you send to landfills.
Waste statistics also influence product design. When you see that single‑use packaging has a 90 % landfill rate, you might switch to reusable containers or adopt a closed‑loop system. Customers notice these moves, and you gain a competitive edge.
Finally, regulators increasingly tie compliance to measured outcomes. Knowing the exact percentage of waste you recycle can keep you ahead of new rules, avoid fines, and even qualify you for government incentives aimed at sustainable manufacturing.
Bottom line: keep an eye on the numbers, update them regularly, and let waste statistics shape your strategy. When data and action align, you reduce costs, protect the environment, and build a brand that customers trust.
Who Wastes the Most Plastic? Global Plastic Waste Statistics and Surprising Facts
Which countries, companies, and industries actually waste the most plastic? Check out up-to-date facts, eye-opening stats, and easy action tips.