Plastic Manufacturing Waste Calculator
Calculate Your Plastic Leakage
Enter your manufacturing metrics to estimate potential plastic leakage into the ocean.
How Your Data Compares
Based on 2024 industry data from major plastic manufacturers
Your Potential Plastic Leakage
Impact Reduction Potential
By improving your recycling rate from 35% to 50% and reducing leakage to 1%, you could prevent over 150,000 tons of plastic from entering the ocean annually.
Key Takeaways
- Most ocean‑bound plastic originates from post‑consumer waste, but manufacturing‑stage losses also add up.
- Major plastic manufacturers account for a predictable share of mis‑managed waste through production overruns, accidental spills, and insufficient take‑back programs.
- Regulations such as the EU Plastics Strategy and Extended Producer Responsibility (EPR) are shifting liability toward the source.
- Effective solutions combine tighter process controls, transparent reporting, and partnership with recyclers.
- Consumers can drive change by demanding closed‑loop packaging and supporting brands with credible sustainability commitments.
When you hear the phrase “plastic in the ocean,” the mental picture is usually a tide of grocery‑bag litter drifting along beaches. While that visual is spot‑on, the story behind the waste is more complex. It isn’t just careless beachgoers or faulty waste‑management systems; a portion of the debris starts its journey much earlier-inside the factories that make the plastics we use every day.
Plastic manufacturing companies are entities that transform raw polymers such as polyethylene, polypropylene, and PET into the everyday items we rely on. Their processes involve extrusion, molding, and cutting, each step releasing tiny particles or larger off‑cuts that, if not captured, can slip into waterways.
How Plastic Leaves the Factory Floor
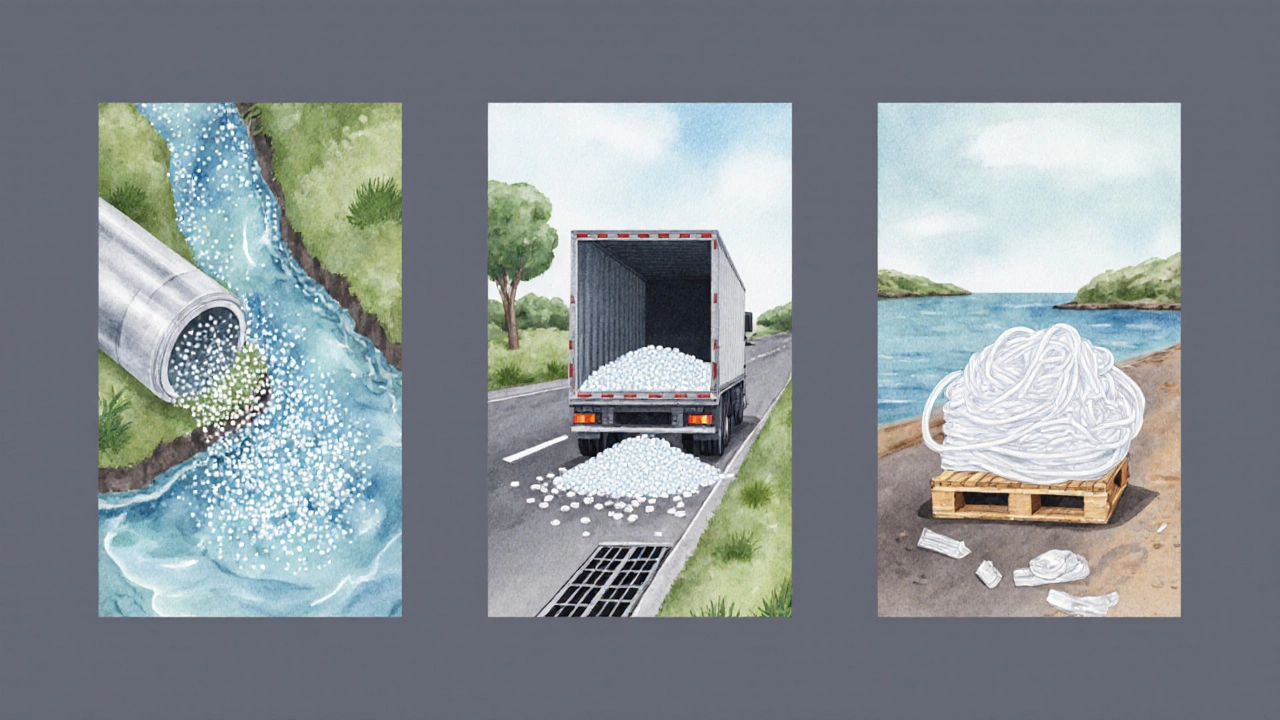
The path from a production line to the open sea can be broken down into three main leak points.
- Process losses. During extrusion or injection molding, microscopic beads-often called microplastics-can be carried away by cooling water or air exhaust. If treatment systems are outdated, these particles can end up in municipal wastewater.
- Transportation spills. Finished goods travel in bulk containers, on trucks, or via ships. A pallet of loose pellets that isn’t tightly sealed can be blown onto roads, entering storm drains that lead straight to rivers.
- Packaging waste. Many manufacturers ship their products in single‑use plastic wrapping. When that wrapping is discarded by downstream users, it adds to the pool of mis‑managed waste.
According to a 2023 study by the Ocean Conservancy, about 5 % of global plastic waste can be traced back to industrial mishandling before it ever reaches a consumer’s hands. That may sound small, but when you multiply it by the 400 million metric tons of plastic produced annually, you’re looking at roughly 20 million tons of material that could be leaking into the environment.
Major Players and Their Waste Footprint
Not all manufacturers have the same track record. Below is a snapshot of five of the world’s biggest producers, their annual polymer output, and the latest publicly reported recycling or take‑back rates. Data are drawn from corporate sustainability reports and third‑party audits up to August 2025.
| Company | Annual Polymer Production (million tons) | Recycling Rate % | Take‑back Program Scope |
|---|---|---|---|
| Dow | 6.2 | 35 | Global, focus on PET bottles |
| ExxonMobil Chemical | 5.8 | 28 | North America, post‑consumer bags |
| LyondellBasell | 4.9 | 40 | Europe, mixed‑plastic films |
| INEOS | 4.1 | 22 | Asia‑Pacific, industrial pellets |
| SABIC | 3.7 | 30 | Middle East, expanded polystyrene |
Notice the variation: LyondellBasell leads with a 40 % recycling rate, partly because it has invested heavily in circular‑economy partnerships. In contrast, INEOS’s lower figure reflects a heavier reliance on single‑use packaging in its Asian markets.
Regulatory Pressure and Industry Initiatives
Governments are tightening the screws. The European Union’s Plastics Strategy set a 55 % recyclable content target for all plastic packaging by 2030. Meanwhile, the United Nations’ Extended Producer Responsibility (EPR) framework shifts the cost of collection and recycling onto the manufacturers themselves.
In the Asia‑Pacific region, the International Maritime Organization (IMO) has introduced stricter ballast‑water treatment standards that indirectly curb marine plastics by limiting waste discharge from cargo ships.
Many companies are answering the call with voluntary programs. Dow’s “Circular Plastics Vision” pledges to use 100 % recycled content in new packaging by 2035. SABIC’s “Eco‑Design Lab” works with customers to redesign products that are easier to recycle and less prone to fragmenting into microplastics.
Case Study: PET Bottle Production and Ocean Leakage
Polyethylene terephthalate (PET bottles) illustrate the full lifecycle of waste. A typical PET bottling plant produces millions of bottle‑preforms daily. During the blow‑moulding stage, a fraction of the resin is lost as fine dust. If the plant’s air‑filter system isn’t upgraded, that dust can travel with the plant’s exhaust and settle near waterways.
One 2024 audit of a major North‑American bottler found that 0.7 % of the total polymer feed (about 45 kilograms per hour) escaped capture. Over a year, that equates to roughly 400 tons of micro‑PET that could end up in local rivers-a non‑trivial contribution to the global microplastic load.
The company responded by installing electrostatic precipitators and committing to a 90 % capture rate by 2026. Early results show a 55 % reduction in airborne PET particles, demonstrating that technology upgrades can make a measurable dent.
What Makes a Manufacturer “Responsible”?
Responsibility can be boiled down to three measurable criteria.
- Leakage Prevention. Demonstrable controls on process emissions, documented spill‑response protocols, and third‑party verification.
- Take‑Back Coverage. A publicly disclosed program that collects post‑consumer plastic, with clear metrics on volume returned.
- Transparency. Regular sustainability reports that include raw‑material sourcing, waste‑stream data, and progress toward set targets.
When a company scores high on all three, it’s generally safer to trust that its products are less likely to become ocean waste.
Checklist for Manufacturers Looking to Reduce Ocean Impact
- Audit every stage for plastic loss-measure pellets, dust, and off‑cuts.
- Install closed‑loop water‑recirculation and high‑efficiency air filtration.
- Adopt reusable or recyclable packaging for bulk shipments.
- Partner with certified recyclers and report take‑back volumes quarterly.
- Publish a clear, third‑party‑verified sustainability report.
- Engage in industry coalitions that push for stricter EPR laws.
Consumer Power: How Buying Choices Influence Manufacturers
Even if you’re not a policymaker, your purchasing habits shape the market. Brands that publish credible take‑back data and achieve high recycling rates see a measurable uptick in sales-often 5‑10 % higher than their less‑transparent peers, according to a 2024 Nielsen survey.
Look for labels such as “recycled content ≥ 30 %,” “EPR compliant,” or “partnered with Plastic Bank.” Those signals usually mean the company has already invested in the leak‑prevention steps outlined above.
Future Outlook: Zero‑Leak Manufacturing?
Technological leaps are making the “zero‑leak” goal realistic. Emerging solutions include:
- AI‑driven monitoring. Real‑time sensors detect particle concentrations in exhaust streams and trigger automatic filtration adjustments.
- Bio‑based polymers. Materials such as polyhydroxyalkanoates (PHAs) break down faster if they do escape, reducing long‑term marine impact.
- Digital product passports. Blockchain‑based traceability records the amount of recycled content in each batch, making false claims harder.
When these innovations become mainstream, the share of manufacturing‑origin plastic in the ocean could drop below 1 % within the next decade.
Take Action Today
Whether you run a small extrusion shop or a multinational petrochemical giant, the steps to curb ocean dumping are clear. Start with an audit, invest in capture technology, and be transparent about progress. The public, regulators, and investors are watching-show them you’re part of the solution, not the problem.
What is the biggest source of plastic that ends up in the ocean?
Post‑consumer waste-particularly single‑use bags, bottles, and packaging-accounts for roughly 80 % of marine plastic, but manufacturing‑stage losses add an estimated 5 %.
How can manufacturers prevent microplastic emissions?
Install high‑efficiency air filters, recycle cooling‑water streams, and use closed‑loop systems that capture polymer dust before it leaves the plant.
What is Extended Producer Responsibility (EPR)?
EPR is a policy approach that makes manufacturers financially responsible for the collection, recycling, or disposal of their products once consumers discard them.
Are there any companies that have achieved zero‑leak production?
A few niche producers in Europe have reported near‑zero emissions by using advanced filtration and real‑time monitoring, but scaling that to global megaplants is still a work in progress.
How can consumers identify responsible plastic manufacturers?
Look for transparent sustainability reports, verified recycling rates, and participation in recognized take‑back schemes or EPR programs.